APAC Equity Finance & Portfolio Finance
Cherin Kim
APAC equity finance professional with a technical edge
I build automations and data-driven workflows that sharpen financing decisions and surface insights others might miss - bringing both market depth and technical precision to equity finance across APAC.
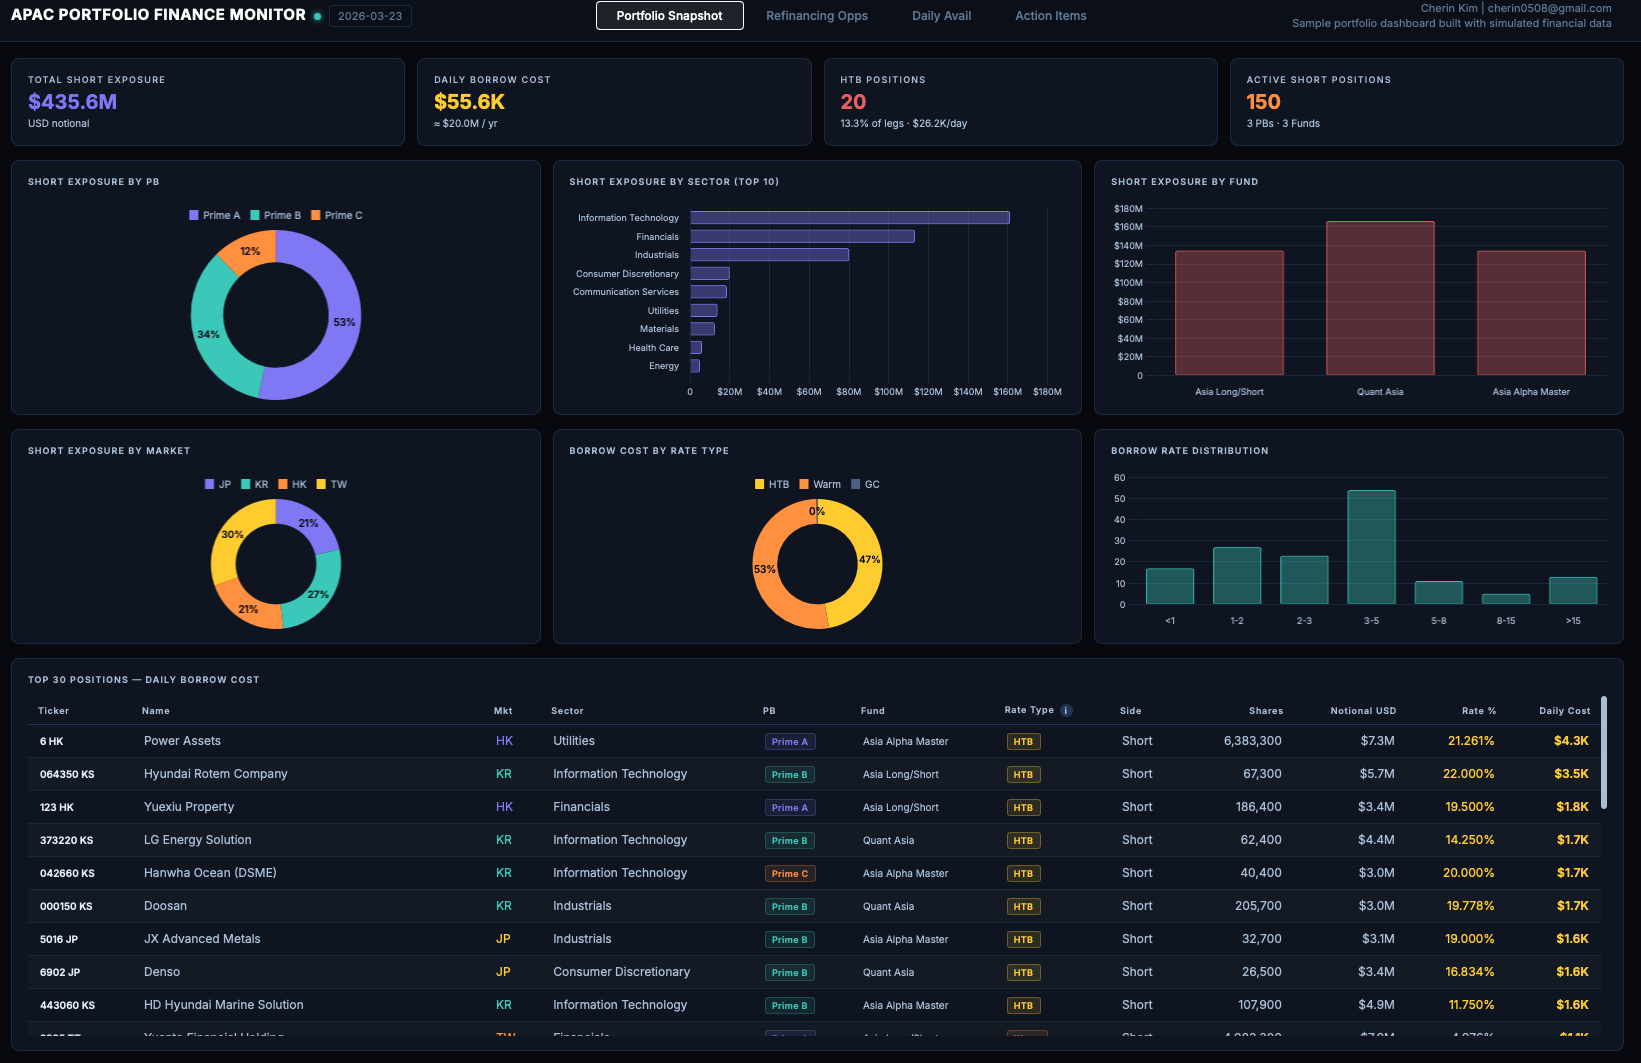
HTB Positions
20
Daily Borrow Cost
$55.6K
